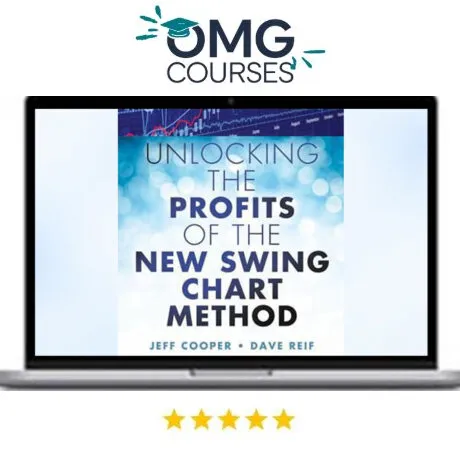
Jeff Cooper& David Reif – Unlocking the Profits of the New Swing Chart Method
$ 997,00 Original price was: $ 997,00.$ 18,00Current price is: $ 18,00.
Download Jeff Cooper & David Reif – Unlocking the Profits of the New Swing Chart Method (5.37 GB) [Google Drive] This course by Jeff Cooper and David Reif introduces a groundbreaking swing chart method for market analysis. With practical applications and historical insights, it is a must-have resource for traders seeking to improve their accuracy and profitability in market predictions.

- 24/7 Customer Support & instant Assistance
- High-Quality Orig inal Content
- Regular Updates to Course Materials
- Verified and Reliable Download L inks
- Secure Payment Options

Jeff Cooper & David Reif – Unlocking the Profits of the New Swing Chart Method
Download Course Proof
Course Description
Course Description
Discover a better way to trade with Unlocking the Profits of the New Swing Chart Method, a course designed to transform the way you understand market trends. Created by trading experts Jeff Cooper and David Reif, this in-depth program introduces an innovative approach to swing charting by integrating the element of time, giving you a clearer view of market movements.
What You’ll Get
16 Hours of Expert Training
The course includes 16 hours of video instruction paired with a comprehensive reference manual featuring over 300 full-color charts. This structure guides traders from the basics of swing charting to advanced techniques, ensuring you’re equipped with actionable knowledge.
Revolutionary Trend Visualization
The core of this course lies in a new trend visualization method that adds time to traditional swing charts. Paired with Gann’s Square of 9 theory, this approach reveals the deeper patterns driving market behavior, offering precise buy and sell signals.
Decades of Market Insights
By analyzing the Dow Jones Industrial Average from the 1920s to today, the authors showcase how their method works across different market conditions and timeframes, proving its reliability and adaptability.
Real-World Applications
The course goes beyond theory with practical examples of how to apply the method to stocks, bonds, and commodities. These case studies illustrate how to seamlessly integrate these techniques into your personal trading strategy.
User-Friendly Design
With an intuitive navigation menu, you can easily find specific charts, topics, or sections, making the course accessible and simple to use. Whether you’re a novice or experienced trader, this structure ensures a smooth learning experience.
Why This Course Matters
Unlocking the Profits of the New Swing Chart Method isn’t just another trading course. It’s a game-changer for those who want to enhance their market analysis skills. From cutting-edge visualization techniques to historical context and practical applications, this program empowers traders to increase accuracy and profitability. Prepare to see the market in a whole new light.
Key Features
- 16 hours of expert-led video training
- Comprehensive reference manual with 300+ full-color charts
- Integration of time into swing charting for better trend visualization
- Application of Gann’s Square of 9 theory for precise market signals
- Historical analysis of the Dow Jones Industrial Average from the 1920s to today
- Practical case studies for stocks, bonds, and commodities
- Intuitive navigation for easy access to course materials
Affordable Courses at Omgcourses.com
At Omgcourses.com, we strive to offer affordable and quality courses for individuals who want to learn but may not have the budget for expensive training. Our courses are designed to provide valuable knowledge at an accessible price point. Explore More Courses. If you prefer to pay via PayPal, Skrill, Payoneer, or Credit/Debit Cards, please feel free to Gmail or Telegram.
FAQs
Q: Why are your courses affordable, and is this website legitimate?
A: We offer courses at affordable rates, largely through group buys, where we participate in collective purchasing. This allows us to pass on the savings to you. While some courses may be priced higher due to factors outside our control, we always strive to keep costs low. Here’s what you can expect:
- Access to videos, PDFs, and documents.
- No access to private Facebook groups or exclusive communities.
- Continuous updates to course content as new materials are released.
Q: How will I receive the course after making a payment, and how long will it take?
A: Upon successful payment, you will receive an email containing a direct link to the course, which will be hosted on Mega.nz.
Q: Do I need a paid Mega.nz account to access the courses?
A: No, you don’t need a paid Mega.nz account. The link will provide access to our allocated quota, so no additional accounts or subscriptions are needed.
Q: How can I be sure I will receive the course I paid for?
A: We guarantee that you will receive the course you paid for. If you have any doubts, we can provide proof of the course content, including screenshots, sample videos, or other relevant details to verify the course materials.
Related products
Premium Trading Courses
Premium Trading Courses
Premium Trading Courses
Premium Trading Courses
Premium Trading Courses
Premium Trading Courses
Premium Trading Courses
Premium Trading Courses


