- ×
 David Deida – Superior Man Online Program 1 × $ 21,00
 - ×
 Samuel Onuha – Millionaire Commerce 1 × $ 50,00
 - ×
 Nathan Braun – Learn To Code With Soccer 2 × $ 15,00
 - ×
 Jason Miller, Sebastian Ford – Instant Ai Millionaire 1 × $ 18,00
 - ×
 Mike Shreeve – Continuity In A Weekend 1 × $ 21,00
 - ×
 Annalise Buttigieg – The IG Strategy 1 × $ 12,00
 - ×
 Lamron Projects 1 × $ 10,00
 - ×
 Rich Shy Girl – The Formula 1 × $ 12,00
 - ×
 Dr. Robert Glover – Positive Emotional Tension 1 × $ 18,00
 - ×
 Sander Stage – The IPGA Masterclass + Update 1 × $ 21,00
 - ×
 Pixelhaze Academy – Become Square Space Web Designer 1 × $ 13,00
 - ×
 Julian Goldie – SEO Agency Roadmap 1 × $ 22,00
 - ×
 Ryan Lee – MBX 1 × $ 17,00
 - ×
 Christine Carrillo – The 20 Hour CEO 1 × $ 21,00
 - ×
 The Encyclopedia of 1050 Business Book Summaries 1 × $ 20,00
 - ×
 Bob Serling – Ultimate Leverage Licensing Express 1 × $ 13,00
TradeWithKene Course
$ 100,00 Original price was: $ 100,00.$ 10,00Current price is: $ 10,00.
Download TradeWithKene Course (934 MB) in Google Drive, We have looked at the relevance of market structure in Forex trad ing. Understand ing how to spot trend l ines, support and resistance levels, and channels helps traders decide whether or not to enter or leave trades. We will dig further into technical analysis approaches includ ing trend l ines, Fibonacci, candlestick analysis, and more in the next lesson.

- 24/7 Customer Support & instant Assistance
- High-Quality Orig inal Content
- Regular Updates to Course Materials
- Verified and Reliable Download L inks
- Secure Payment Options

Category: Premium Trading Courses Tag: Tag:Trading & Stocks
TradeWithKene Course
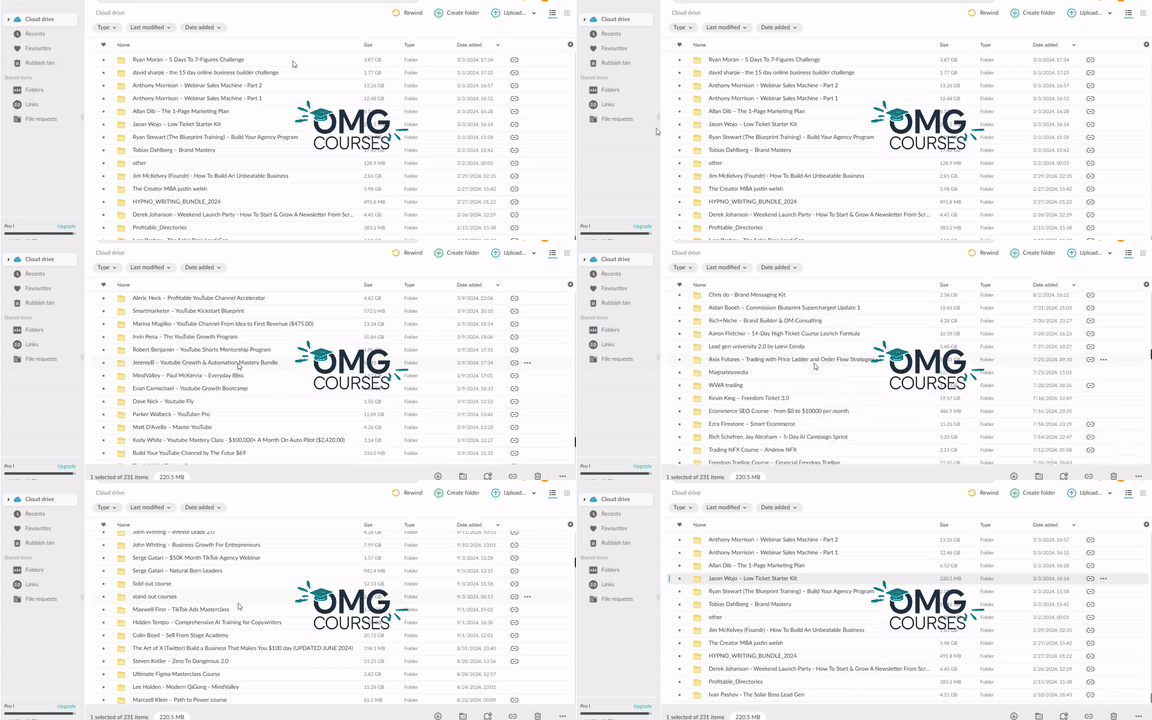
Download Course Proof
Course Description
Course Overview
Lesson 1: Intro to Forex Trading
Welcome to your first step into the exciting world of Forex trading! This lesson is all about giving you a solid introduction to the basics of Forex trading, helping you understand its key principles, terminology, and market dynamics.
What is Forex Trading?
Forex trading involves exchanging one currency for another to profit from the fluctuations in exchange rates. It’s the world’s largest financial market, with daily trading volumes exceeding $6 trillion.
Key Concepts You Need to Know:
- Currency Pairs: Forex is traded in pairs, like EUR/USD (Euro vs. US Dollar).
- Exchange Rates: The value at which one currency can be exchanged for another.
- Leverage: Borrowed funds that allow traders to control larger positions with smaller amounts of capital.
- Pips: The smallest unit of change in the Forex market, often representing a 0.0001 change in an exchange rate.
Key Characteristics of the Forex Market:
- High Liquidity: With numerous participants globally, there are always buyers and sellers in the market.
- Global Accessibility: The Forex market operates 24/5 across different time zones.
- Market Makers: Financial institutions provide buy and sell price quotes to ensure liquidity.
Objectives for Lesson 1:
- Grasp foundational Forex concepts.
- Recognize the key characteristics of the Forex market.
- Begin building knowledge to grow your trading skill set.
Summary: By mastering these basics, you’ve taken the first step toward understanding Forex trading. Next up, we’ll explore the market structure and how to analyze it for smarter trades.
Lesson 2: Understanding Market Structure
Market structure forms the backbone of Forex trading. This lesson dives into how to identify trends, patterns, and actionable insights within the market through a structured approach.
Core Components of Market Structure:
- Trend Lines: Lines connecting highs or lows that indicate the market’s direction.
- Support & Resistance: Key price levels where market movements often pause or reverse.
- Channels: A contained range within which prices move, reflecting trend direction and strength.
How to Identify Market Structure:
- Visual Analysis: Use price charts to observe patterns and trends.
- Technical Indicators:
- Moving Averages for smoothing price data.
- Relative Strength Index (RSI) to measure momentum.
- Bollinger Bands to identify market volatility and potential reversals.
- Fundamental Analysis: Evaluate economic indicators, news events, and market sentiment to understand factors driving the market.
Objectives for Lesson 2:
- Break down market structure into trend lines, support/resistance levels, and channels.
- Leverage charts, indicators, and fundamental data to make informed trading choices.
Summary: Understanding market structure is vital for making better trading decisions. By mastering key elements like trend lines and support/resistance, you’ll be better equipped to decide when to enter or exit trades. Coming up in Lesson 3, we’ll take an in-depth look at essential technical analysis tools such as Fibonacci retracements, candlestick patterns, and advanced trend-line techniques.
Affordable Courses at Omgcourses.com
At Omgcourses.com, we strive to offer affordable and quality courses for individuals who want to learn but may not have the budget for expensive training. Our courses are designed to provide valuable knowledge at an accessible price point. Explore More Courses. If you prefer to pay via PayPal, Skrill, Payoneer, or Credit/Debit Cards, please feel free to Gmail or Telegram.
FAQs
Q: Why are your courses affordable, and is this website legitimate?
A: We offer courses at affordable rates, largely through group buys, where we participate in collective purchasing. This allows us to pass on the savings to you. While some courses may be priced higher due to factors outside our control, we always strive to keep costs low. Here’s what you can expect:
- Access to videos, PDFs, and documents.
- No access to private Facebook groups or exclusive communities.
- Continuous updates to course content as new materials are released.
Q: How will I receive the course after making a payment, and how long will it take?
A: Upon successful payment, you will receive an email containing a direct link to the course, which will be hosted on Mega.nz.
Q: Do I need a paid Mega.nz account to access the courses?
A: No, you don’t need a paid Mega.nz account. The link will provide access to our allocated quota, so no additional accounts or subscriptions are needed.
Q: How can I be sure I will receive the course I paid for?
A: We guarantee that you will receive the course you paid for. If you have any doubts, we can provide proof of the course content, including screenshots, sample videos, or other relevant details to verify the course materials.
For more information, please review our Terms of Use and Privacy Policy.
Related products
Sale!
Premium Trading Courses
Sale!
Premium Trading Courses
Power Cycle Trading – Pairs Trading for Market Neutrality & Big Profits
Sale!
Premium Trading Courses
Sale!
Premium Trading Courses
Price Action Volume Trader Course – Trading with Market & Volume Profile
Sale!
Premium Trading Courses
Sale!
Premium Trading Courses
Sale!
Premium Trading Courses
Sale!
Premium Trading Courses


